Project 1: US Domestic AirLine Performance
-
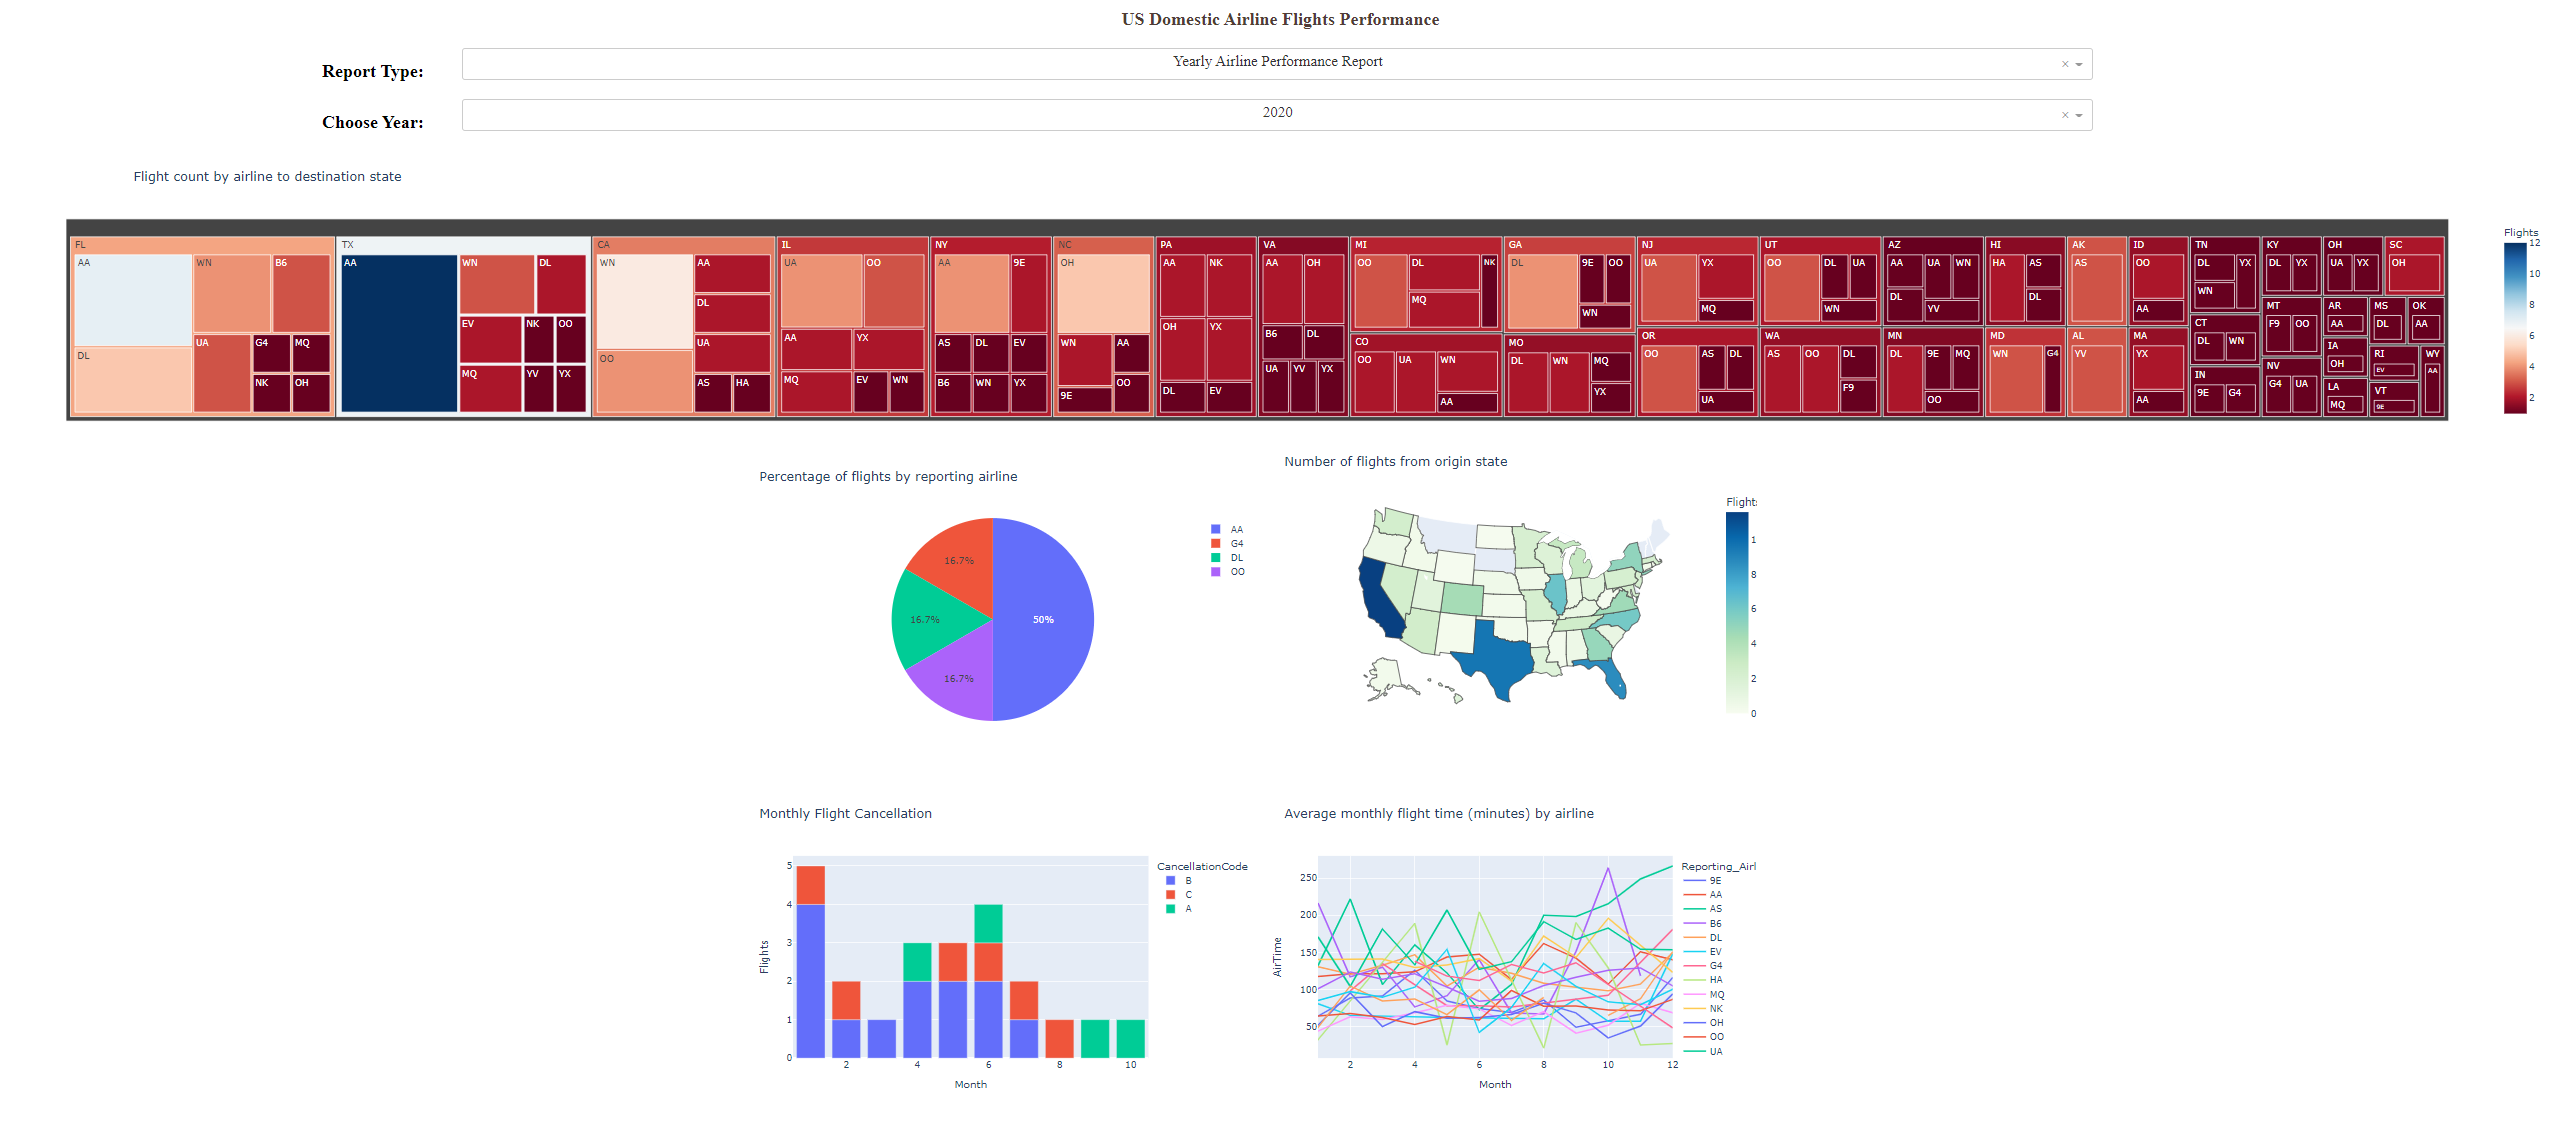
Yearly airline performance report
For the chosen year provide,
- Number of flights under different cancellation categories using bar chart.
- Average flight time by reporting airline using line chart.
- Percentage of diverted airport landings per reporting airline using pie chart.
- Number of flights flying from each state using choropleth map.
- Number of flights flying to each state from each reporting airline using treemap chart.
-
Yearly average flight delay statistics
For the chosen year provide,
- Monthly average carrier delay by reporting airline for the given year.
- Monthly average weather delay by reporting airline for the given year.
- Monthly average national air system delay by reporting airline for the given year.
- Monthly average security delay by reporting airline for the given year.
- Monthly average late aircraft delay by reporting airline for the given year.